Now that I have a number of AirGradient sensors around my house, I have all sorts of data I can make use of about the air quality inside it. I now have to figure out how to make use of all that data. Creating a single unified data point for general air quality based on the AirGradient data is the first thing I’m going to do. To do this, I’ll make use of the IAQUK HACS integration.
The AirGradient Saga
- Making the AirGradient DIY
- Adding an LPS22 to AirGradient and Building a Custom Sensor in EspHome
- Adding TVOC to the AirGradient
- The Indoor Air Quality (UK) HACS Integration and Sensor
Parts
- AirGradient with Esphome
- HACS installed
- Iaquk HACS integration installed
Configuring it
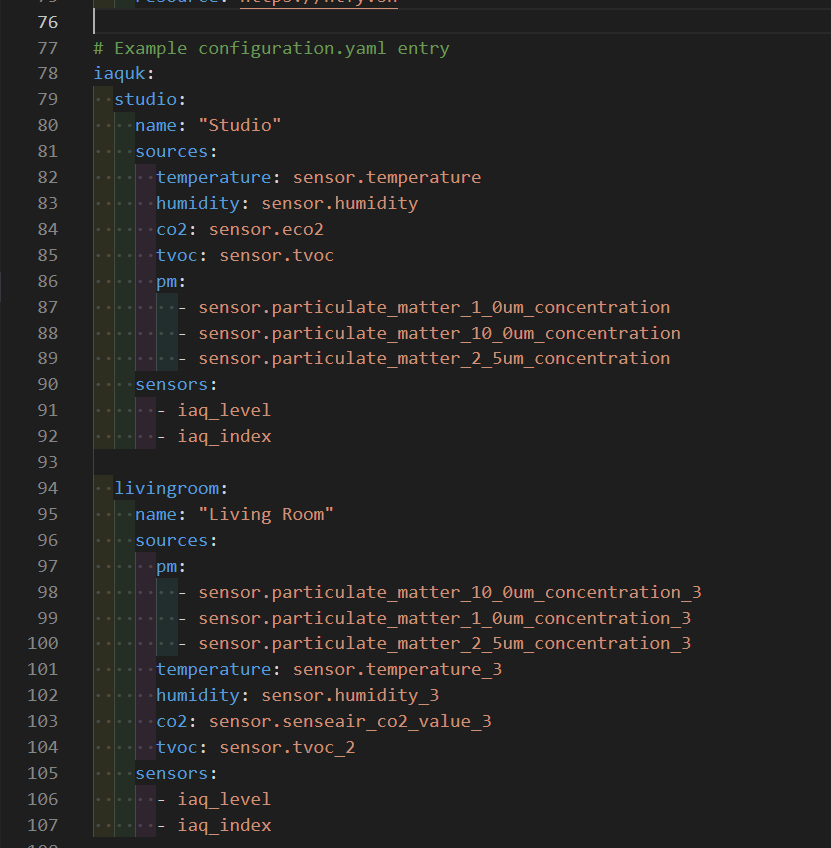
Configuring the sensors is pretty straight forward. Since the integration can make use of LOTS of different air quality metrics, we can put pretty much all of our AirGradient’s sensors into the configuration to give a good accurate output.
The integration only supports one temperature and CO2 sensor though, so my additional sensors won’t be bringing anything here.
iaquk:
  studio:
    name: "Studio"
    sources:
      temperature: sensor.temperature
      humidity: sensor.humidity
      co2: sensor.eco2
      tvoc: sensor.tvoc
      pm:
        - sensor.particulate_matter_1_0um_concentration
        - sensor.particulate_matter_10_0um_concentration
        - sensor.particulate_matter_2_5um_concentration
    sensors:
      - iaq_level
      - iaq_index

  livingroom:
    name: "Living Room"
    sources:
      pm:
        - sensor.particulate_matter_10_0um_concentration_3
        - sensor.particulate_matter_1_0um_concentration_3
        - sensor.particulate_matter_2_5um_concentration_3
      temperature: sensor.temperature_3
      humidity: sensor.humidity_3
      co2: sensor.senseair_co2_value_3
      tvoc: sensor.tvoc_2
    sensors:
      - iaq_level
      - iaq_index
My full configuration is below for the two AirGradients that I have deployed.
Data Displays
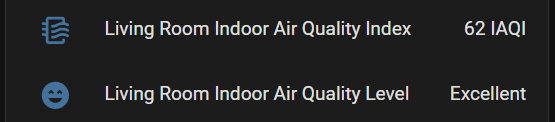
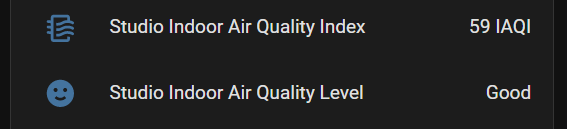
By default, the iaquk integration adds two outputs to home assistant, a value for the air quality index and a status for that value (complete with emoji representation too). Examples of this are below.
I decided to add some gauges to show the values in a way that would give me a good idea how good or bad the air quality was. I do like some good data visualizations and gauges. I used some references from the integration itself to determine the value points for changing the status and picked some color hex values using an online tool.
type: gauge
entity: sensor.unnamed_device_2
segments:
  - from: 0
    color: '#8c241c'
  - from: 26
    color: '#eda12f'
  - from: 39
    color: '#f5f540'
  - from: 52
    color: '#8fcf21'
  - from: 61
    color: '#2a9c24'
name: Studio Indoor Air Quality Index
This produced the gauges below. These looked pretty good, but in the gauge documentation, I saw that I could display them differently.
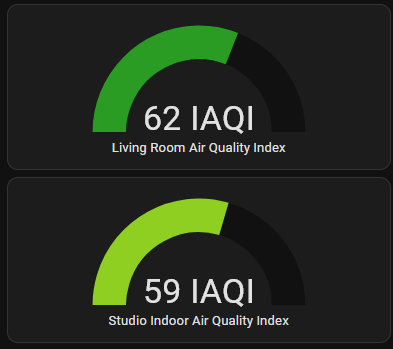
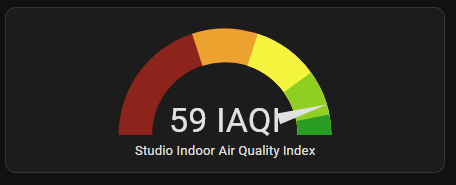
The gauges work well with the colors, however it’s still not super clear the variance between the different values. In the card settings, there is an option to turn in the needle, which helps clear all of that up.
Conclusion
I liked the final results from this. It gives me some good visuals for the air quality that’s quick to glance at and read. It can also be used to easily trigger automations based off the entire index rather than individual values. I would however love to have this value built into my AirGradients and output from there (maybe a future project?)