
Telegraf was the second service I stepped up to influxdb v2. With this service running on unraid, I’ll be able to start monitoring the system and get my dashboards back up and running. I have some other instances of telegraf that will need to be stepped up that are configured differently, but in this case, I’ll be working on my unraid instance first.
Telegraf Step Up
When I first setup my telegraf instance, I went for the quickest / simplest initial setup. This took me to the “untelegraf” configuration. This was built on the appcelerator/telegraf image from Docker Hub. Sadly this image hadn’t been updated in over 4 years. So as a part of my influx v2 step up, I’ll also be stepping up my telegraf image.
This system had a pre-config to make it simple to setup telegraf with influx and was quite convenient. To step up the docker container, I needed to get my configuration out of the untelegraf container. To do this, I mounted a volume in the container, used a terminal into the container, and copied the configuration out of the container and into the volume. This I then used as my basis for the new container.
This pre-config didn’t include the influxdb-2.0 block, so I looked up the docs for influx and pulled that block out, pasted it into my config, and started configuring.
The key configuration entries for influxdb v2 are are the organization, bucket, and token. The URLs can be copied from the pre-existing influxdb v1 section of the configuration. The bucket and organization are created when performing the initial setup in influxdb v2.
The influx v2 setup needed an access token to use for write access and to the bucket. Make sure to select the bucket in the write columns when creating the token. The token will be input into the telegraf configuration.
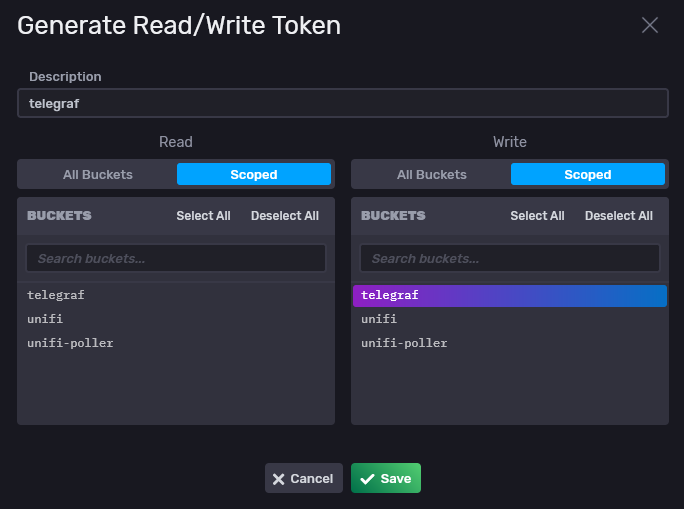
The token string can then be copied and pasted into the telegraf configuration file. This will give telegraf the ability to write to the bucket that we created for it.
# File output is disabled
# Configuration for sending metrics to InfluxDB
[[outputs.influxdb_v2]]
  ## The URLs of the InfluxDB cluster nodes.
  ##
  ## Multiple URLs can be specified for a single cluster, only ONE of the
  ## urls will be written to each interval.
  ##   ex: urls = ["https://us-west-2-1.aws.cloud2.influxdata.com"]
  urls = ["http://192.168.1.211:8086"]

  ## Token for authentication.
  token = "blahblahblah"

  ## Organization is the name of the organization you wish to write to; must exist.
  organization = "rapternet"

  ## Destination bucket to write into.
  bucket = "telegraf"

  ## The value of this tag will be used to determine the bucket.  If this
  ## tag is not set the 'bucket' option is used as the default.
  # bucket_tag = ""

  ## If true, the bucket tag will not be added to the metric.
  # exclude_bucket_tag = false

  ## Timeout for HTTP messages.
  timeout = "5s"

  ## Additional HTTP headers
  # http_headers = {"X-Special-Header" = "Special-Value"}

  ## HTTP Proxy override, if unset values the standard proxy environment
  ## variables are consulted to determine which proxy, if any, should be used.
  # http_proxy = "http://corporate.proxy:3128"

  ## HTTP User-Agent
  # user_agent = "telegraf"

  ## Content-Encoding for write request body, can be set to "gzip" to
  ## compress body or "identity" to apply no encoding.
  # content_encoding = "gzip"

  ## Enable or disable uint support for writing uints influxdb 2.0.
  # influx_uint_support = false

  ## Optional TLS Config for use on HTTP connections.
  # tls_ca = "/etc/telegraf/ca.pem"
  # tls_cert = "/etc/telegraf/cert.pem"
  # tls_key = "/etc/telegraf/key.pem"
  ## Use TLS but skip chain & host verification
  # insecure_skip_verify = false
With the configuration file ready, it was time to start up the container with the configuration in place and see what happens. I followed the container log to make sure everything was working, and when I saw a distinct lack of errors in the service trying to write data, I knew it was finally working again.
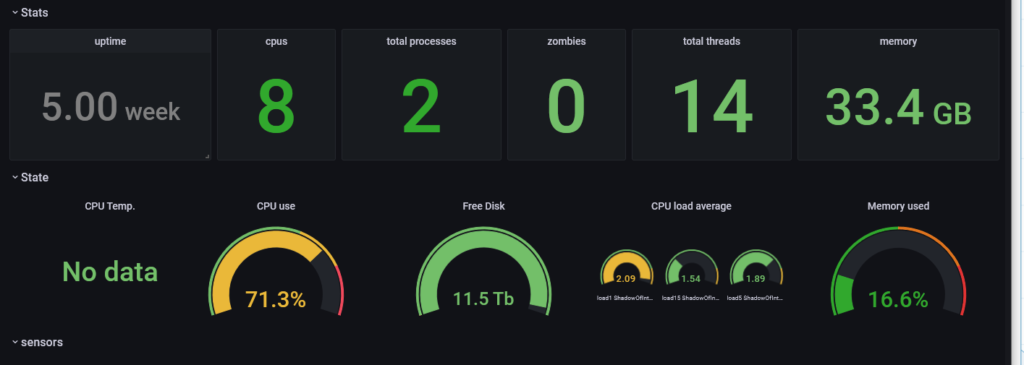
I dug around on Grafana’s website to find a pre-made dashboard that I could use as I’m not much of a dashboard maker. The dashboard I found isn’t as complete as the previous dashboard I used, but it was good enough to know that my system was working. Considering the surprise nature of this step up, I was happy to finally have a dashboard with data again.