I’ve been doing research on making some custom air quality sensors for inside and outside my house. The laser cutter is a main focus point for these as it would be nice to know how it affects air quality (and in the future, maybe activate an air filter based off the sensors readings). When I found out IKEA makes some simple air quality sensors that can be easily hacked using an ESP device, I decided to try it out.
Hardware
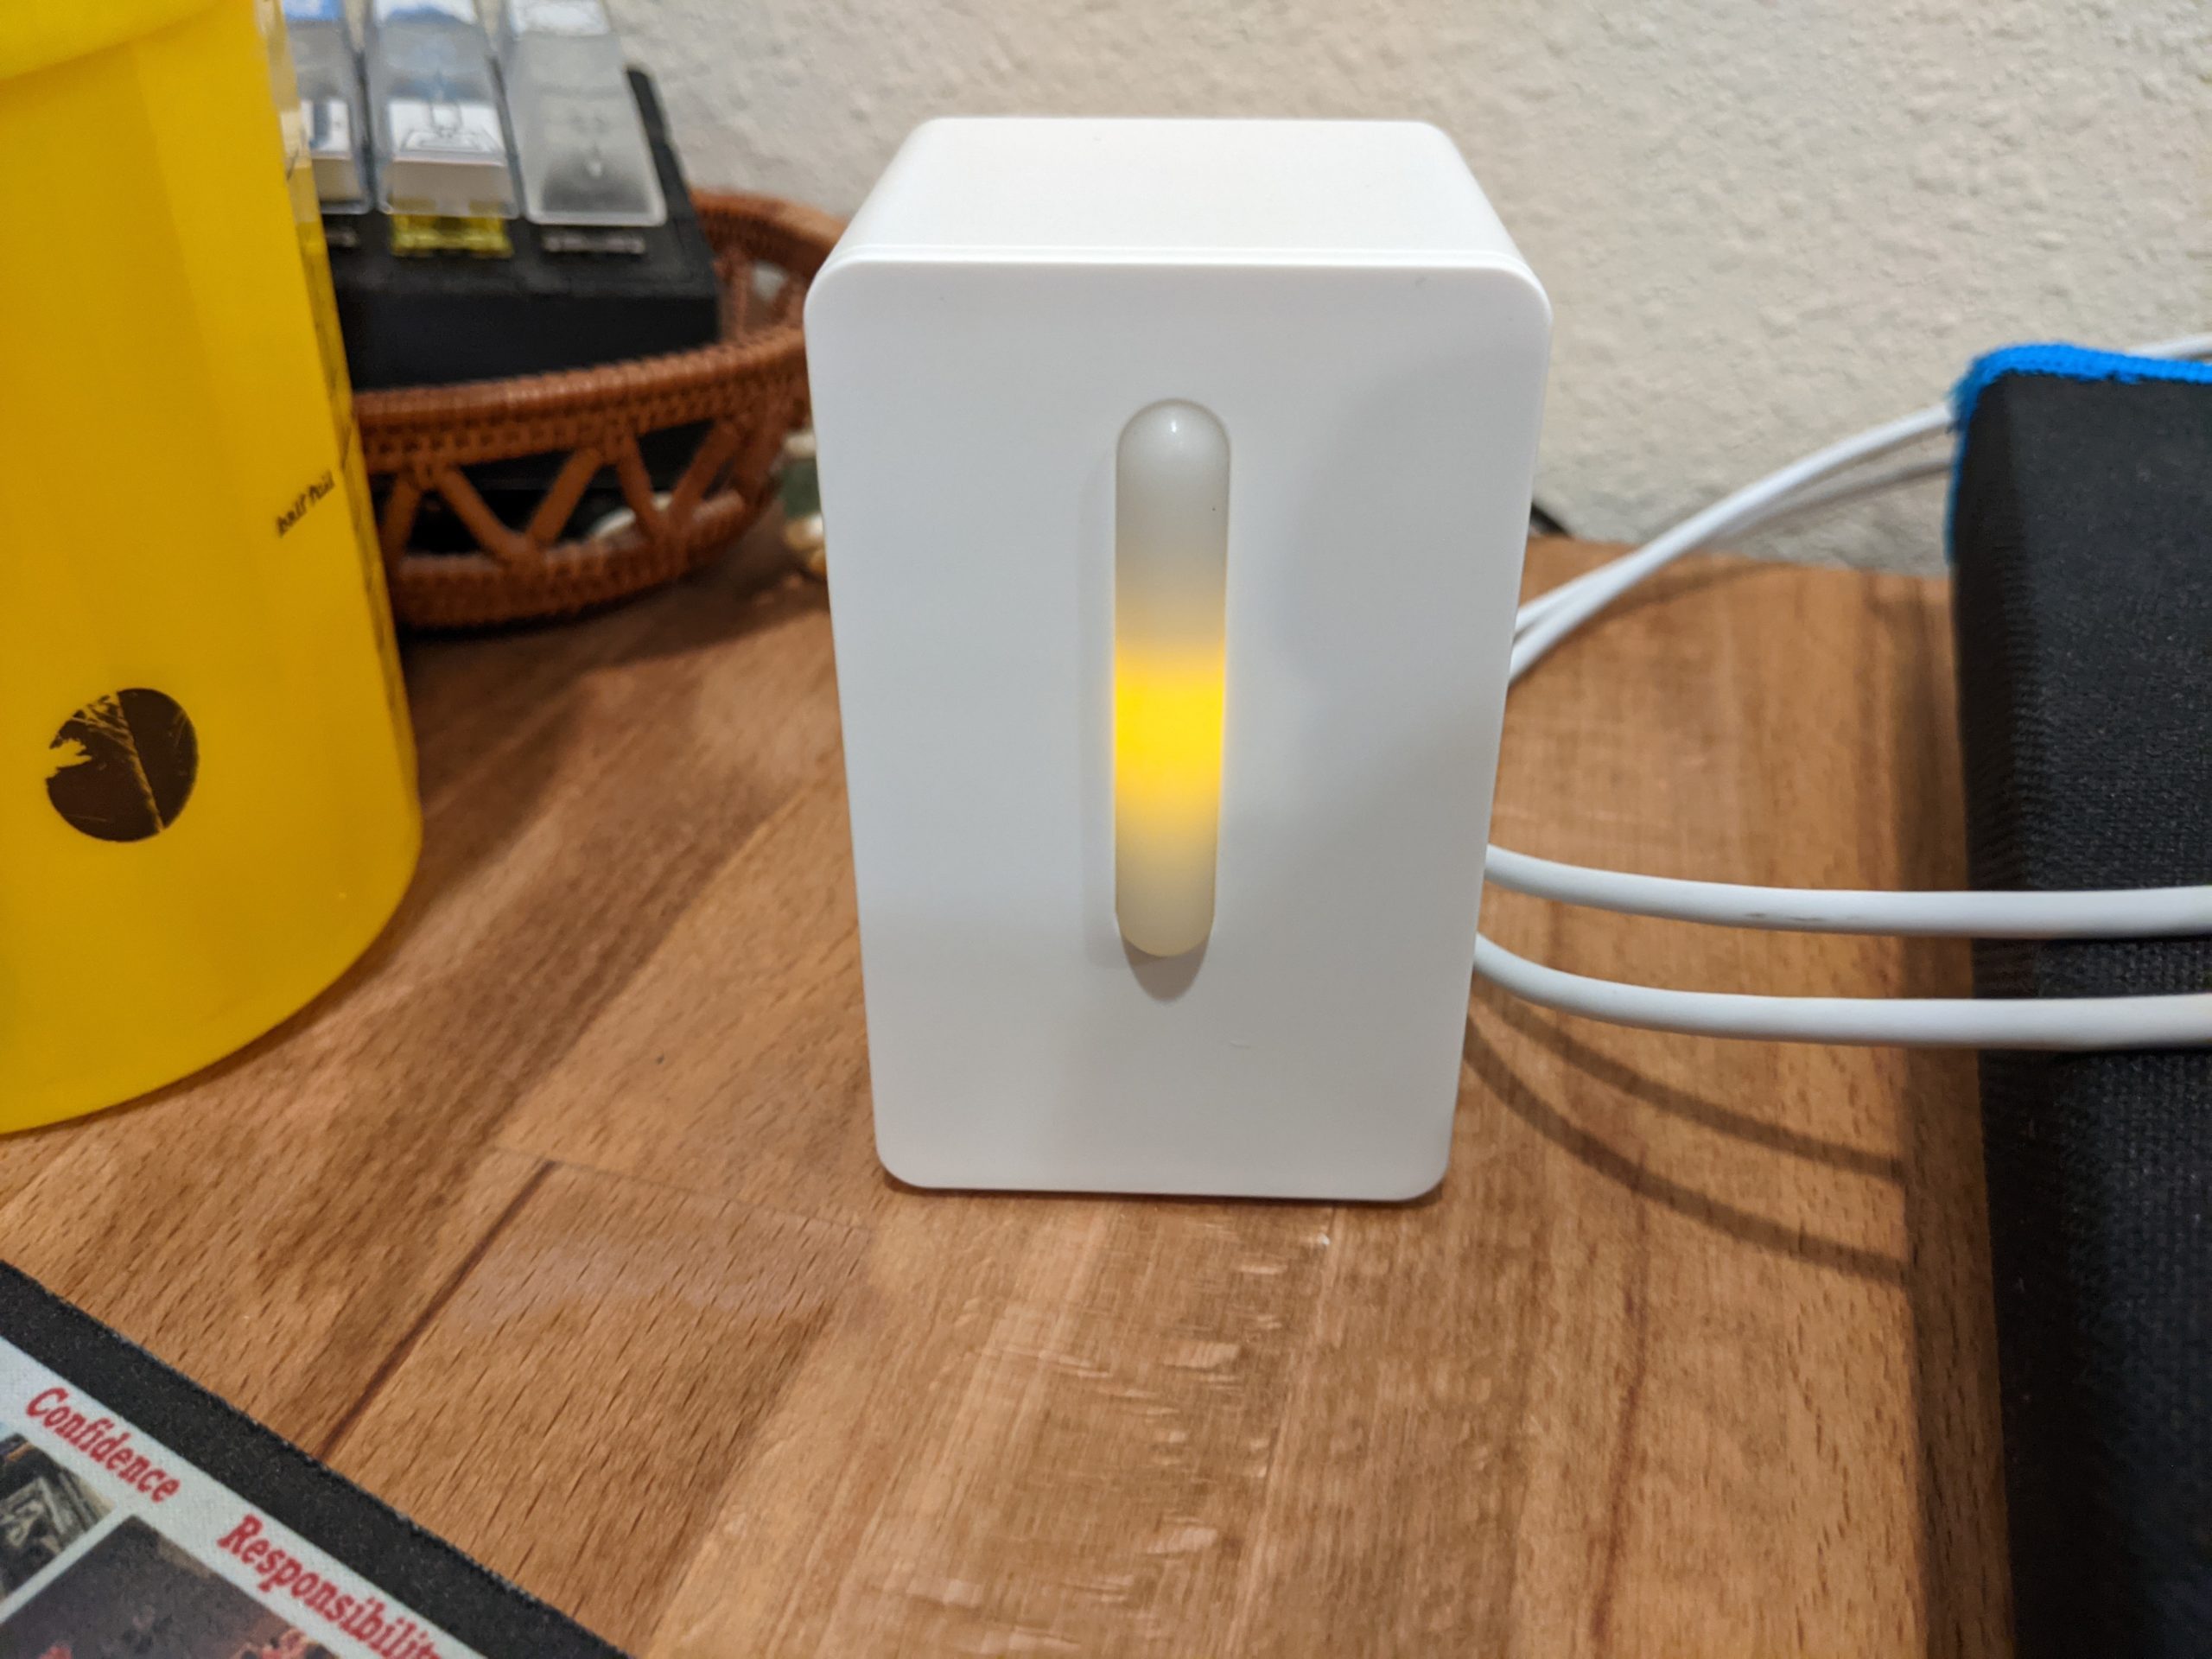
- IKEA VINDRIKTNING air quality sensor
- Wemos D1 Mini (small ESP8266 with a 5v voltage regulator)
Setup
I started by adopting the ESP into home assistant and getting it generically setup in ESPHome. Once I had that done, I started wiring it into the air quality sensor. The sensor has 5 copper pads at the top of the circuit board, these are for debugging, and will work great for our ESP to read the sensor data. We want the +5V, Ground, and Rest pads. These will power the ESP8266 as well as provide the data.
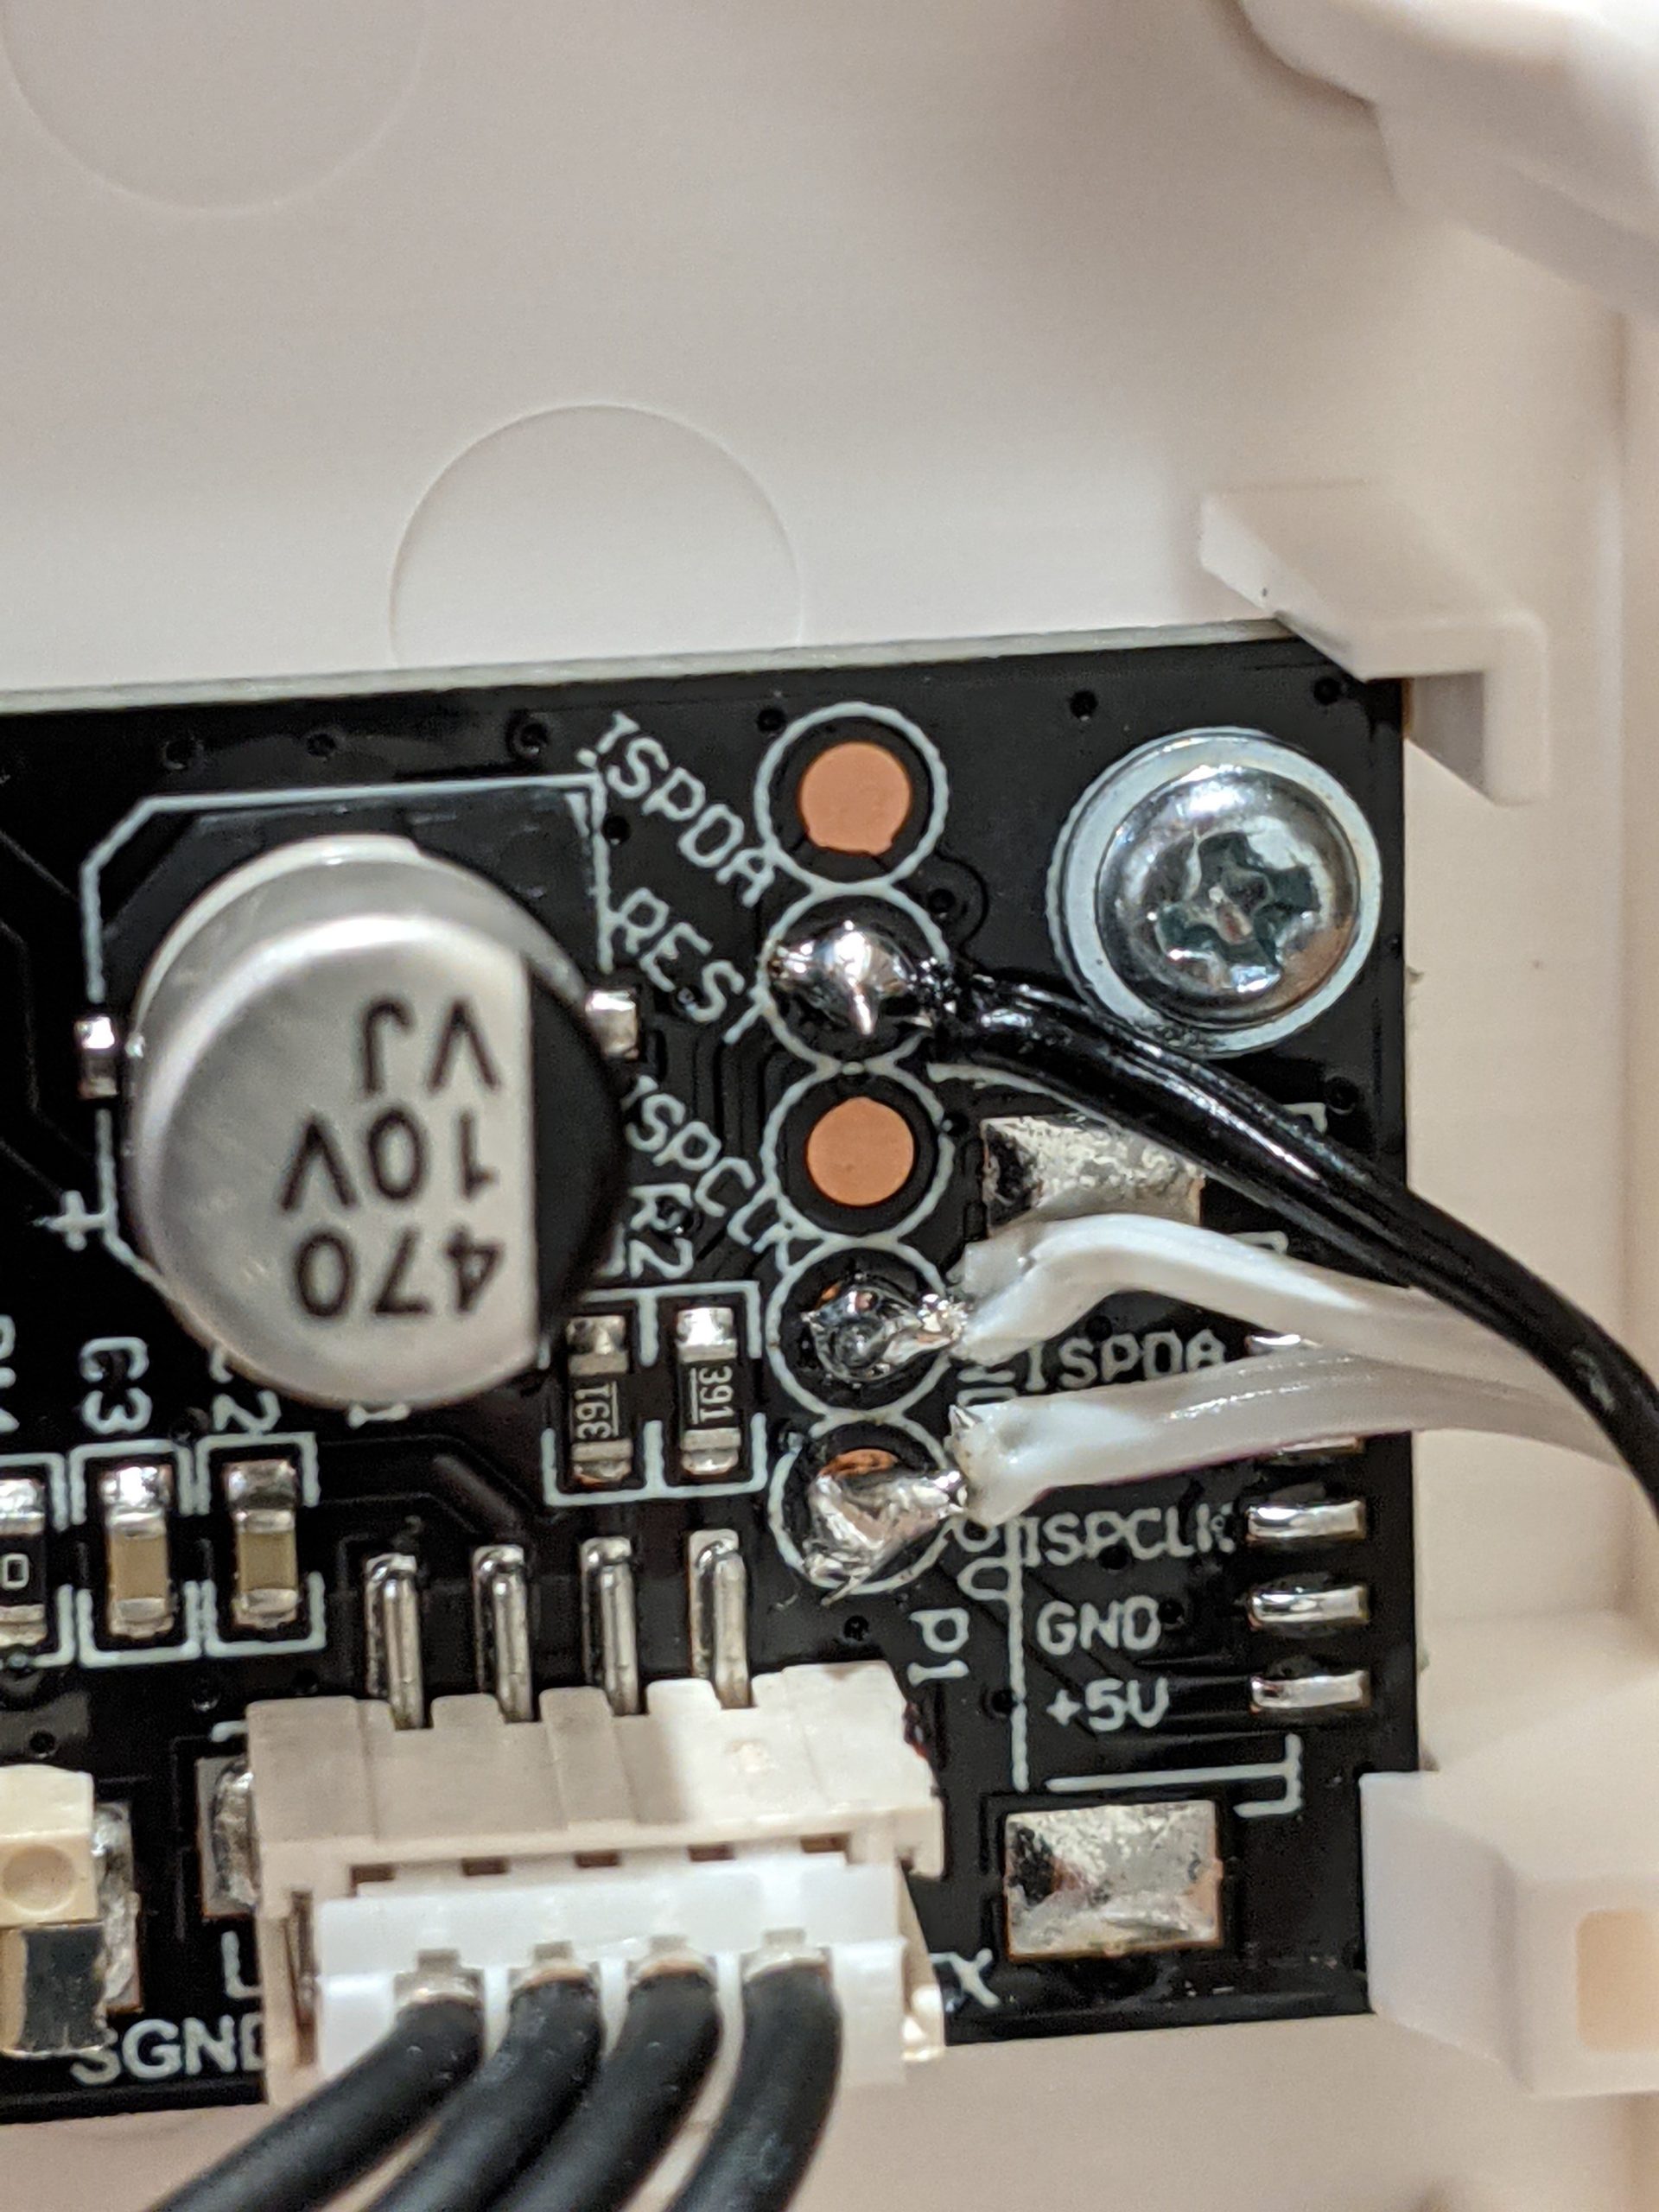
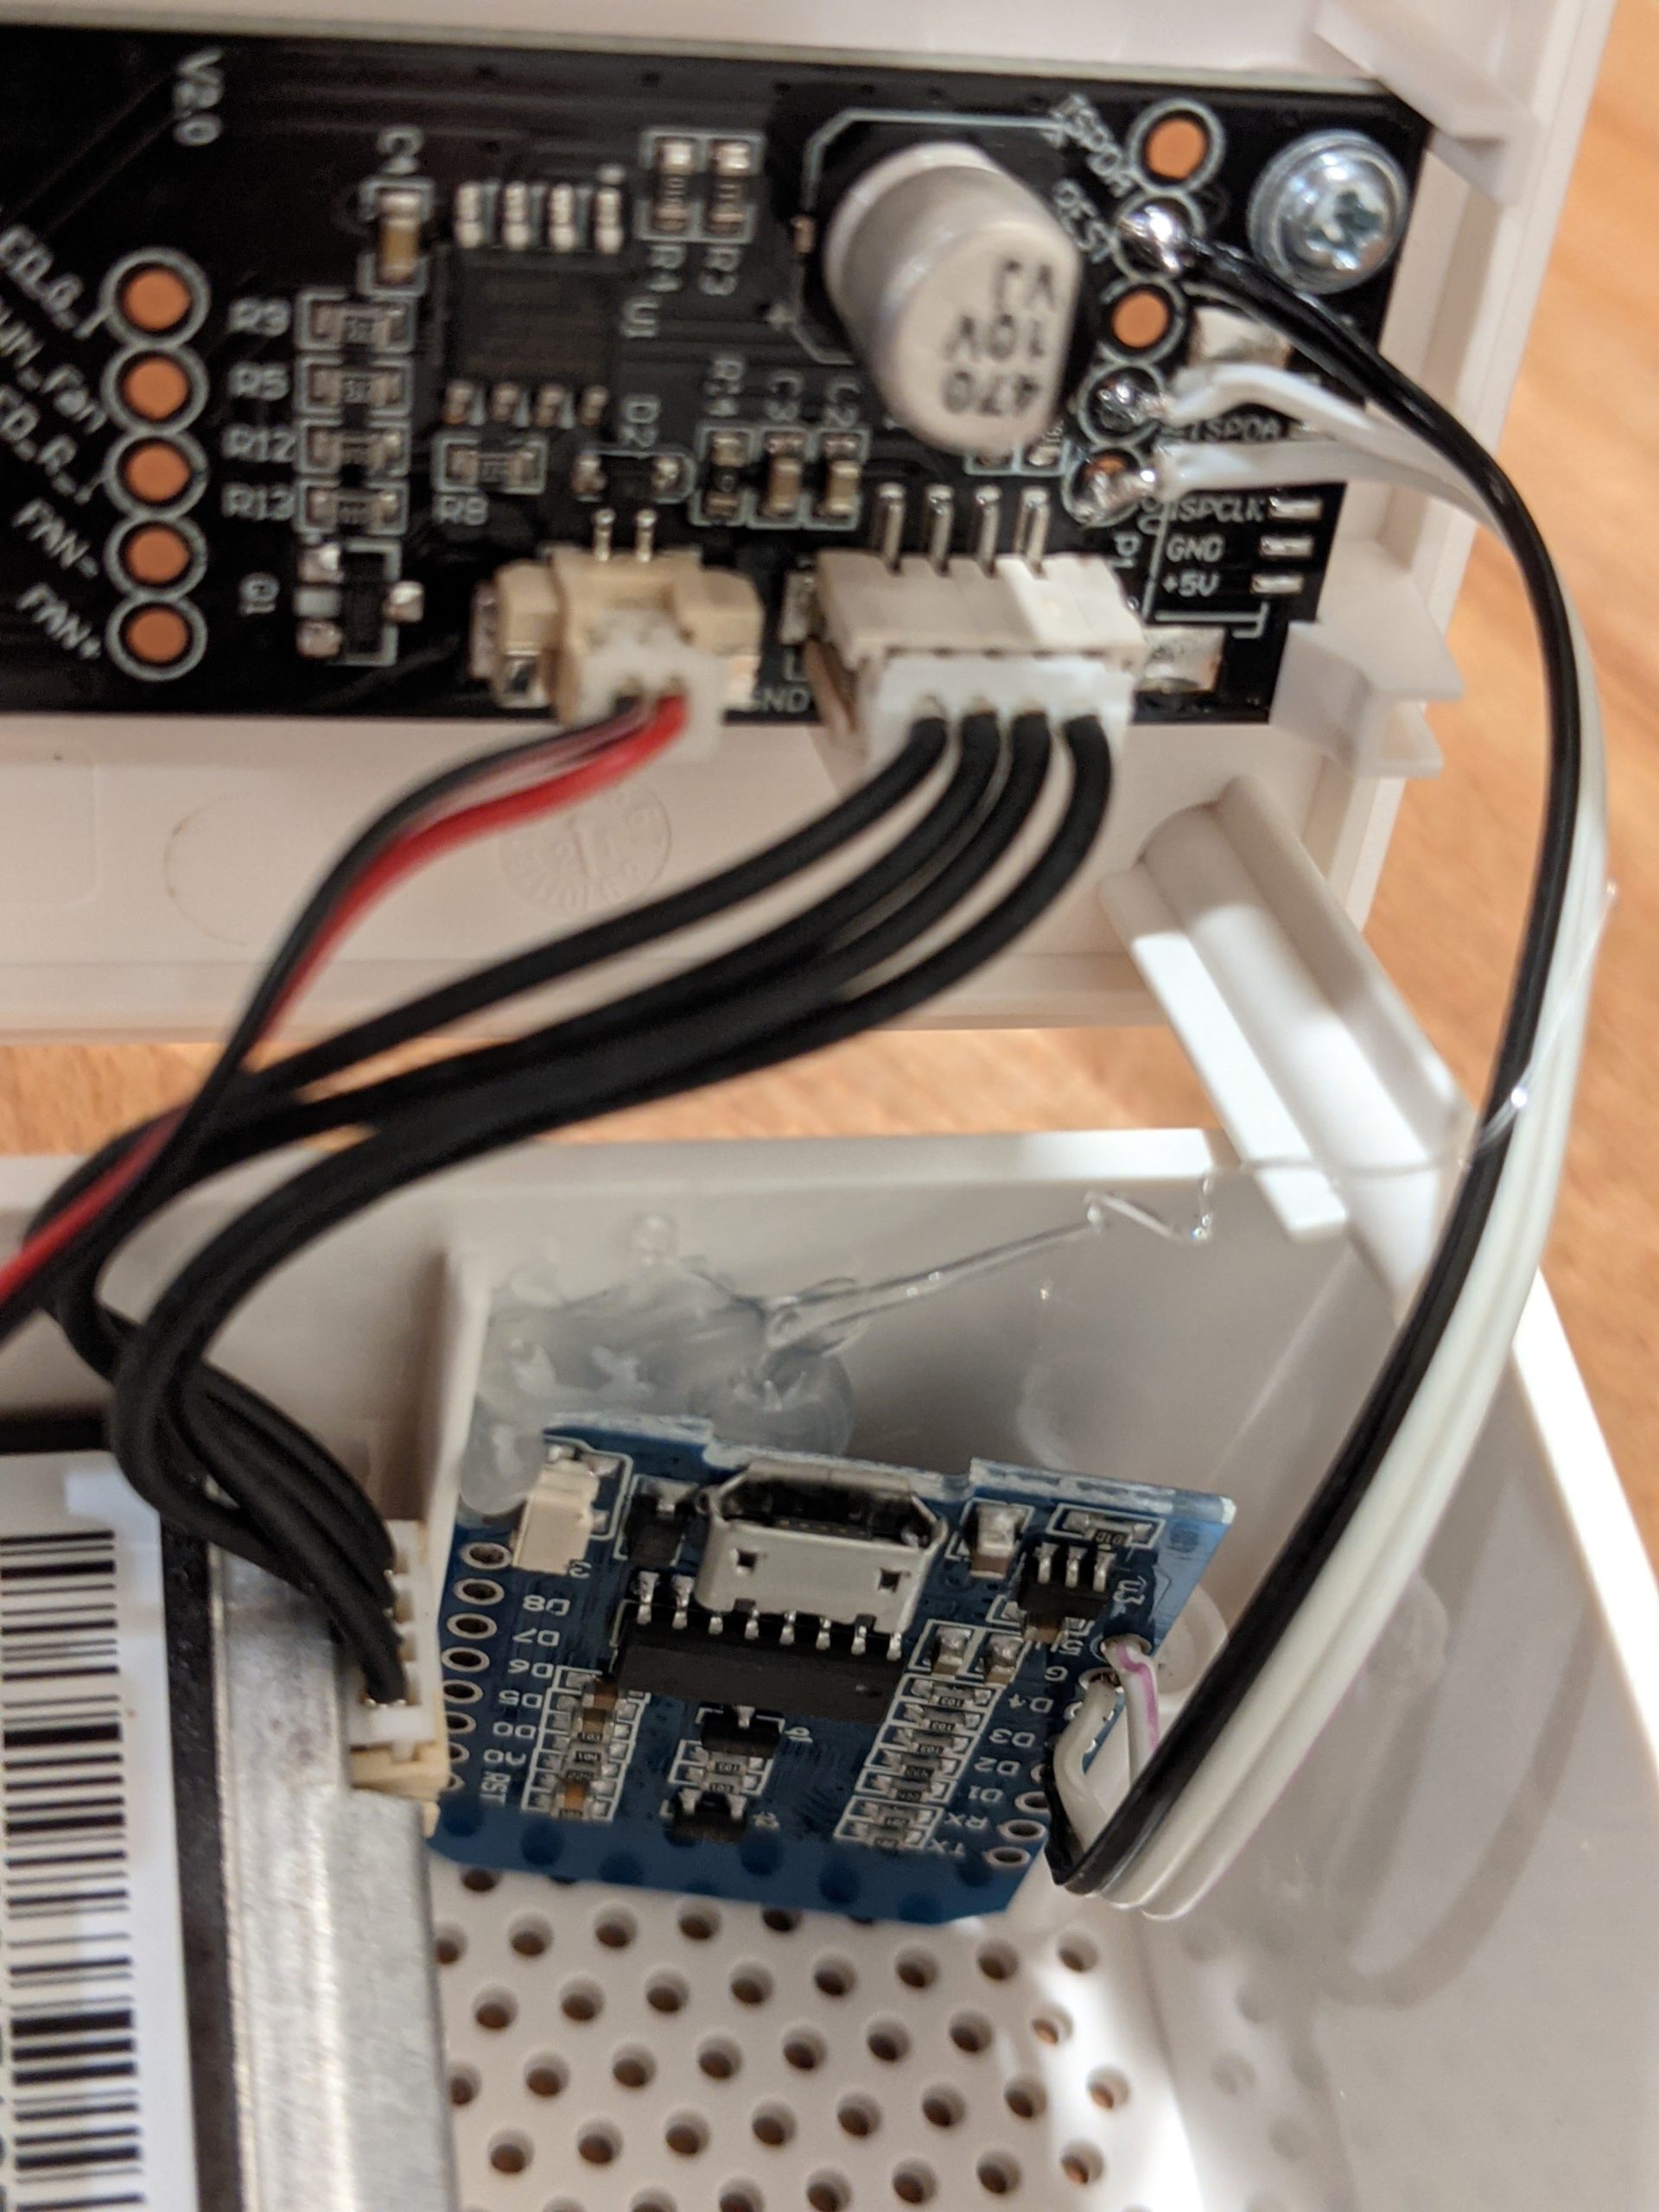
I soldered these to the D1 Mini’s 5v, ground, and D2 pins (GPIO4). I made the wires maybe 4in in length in order to let me open the device without having to disconnect everything. I then hot glued the D1 mini into the case to keep it further out of the airflow inside the device.
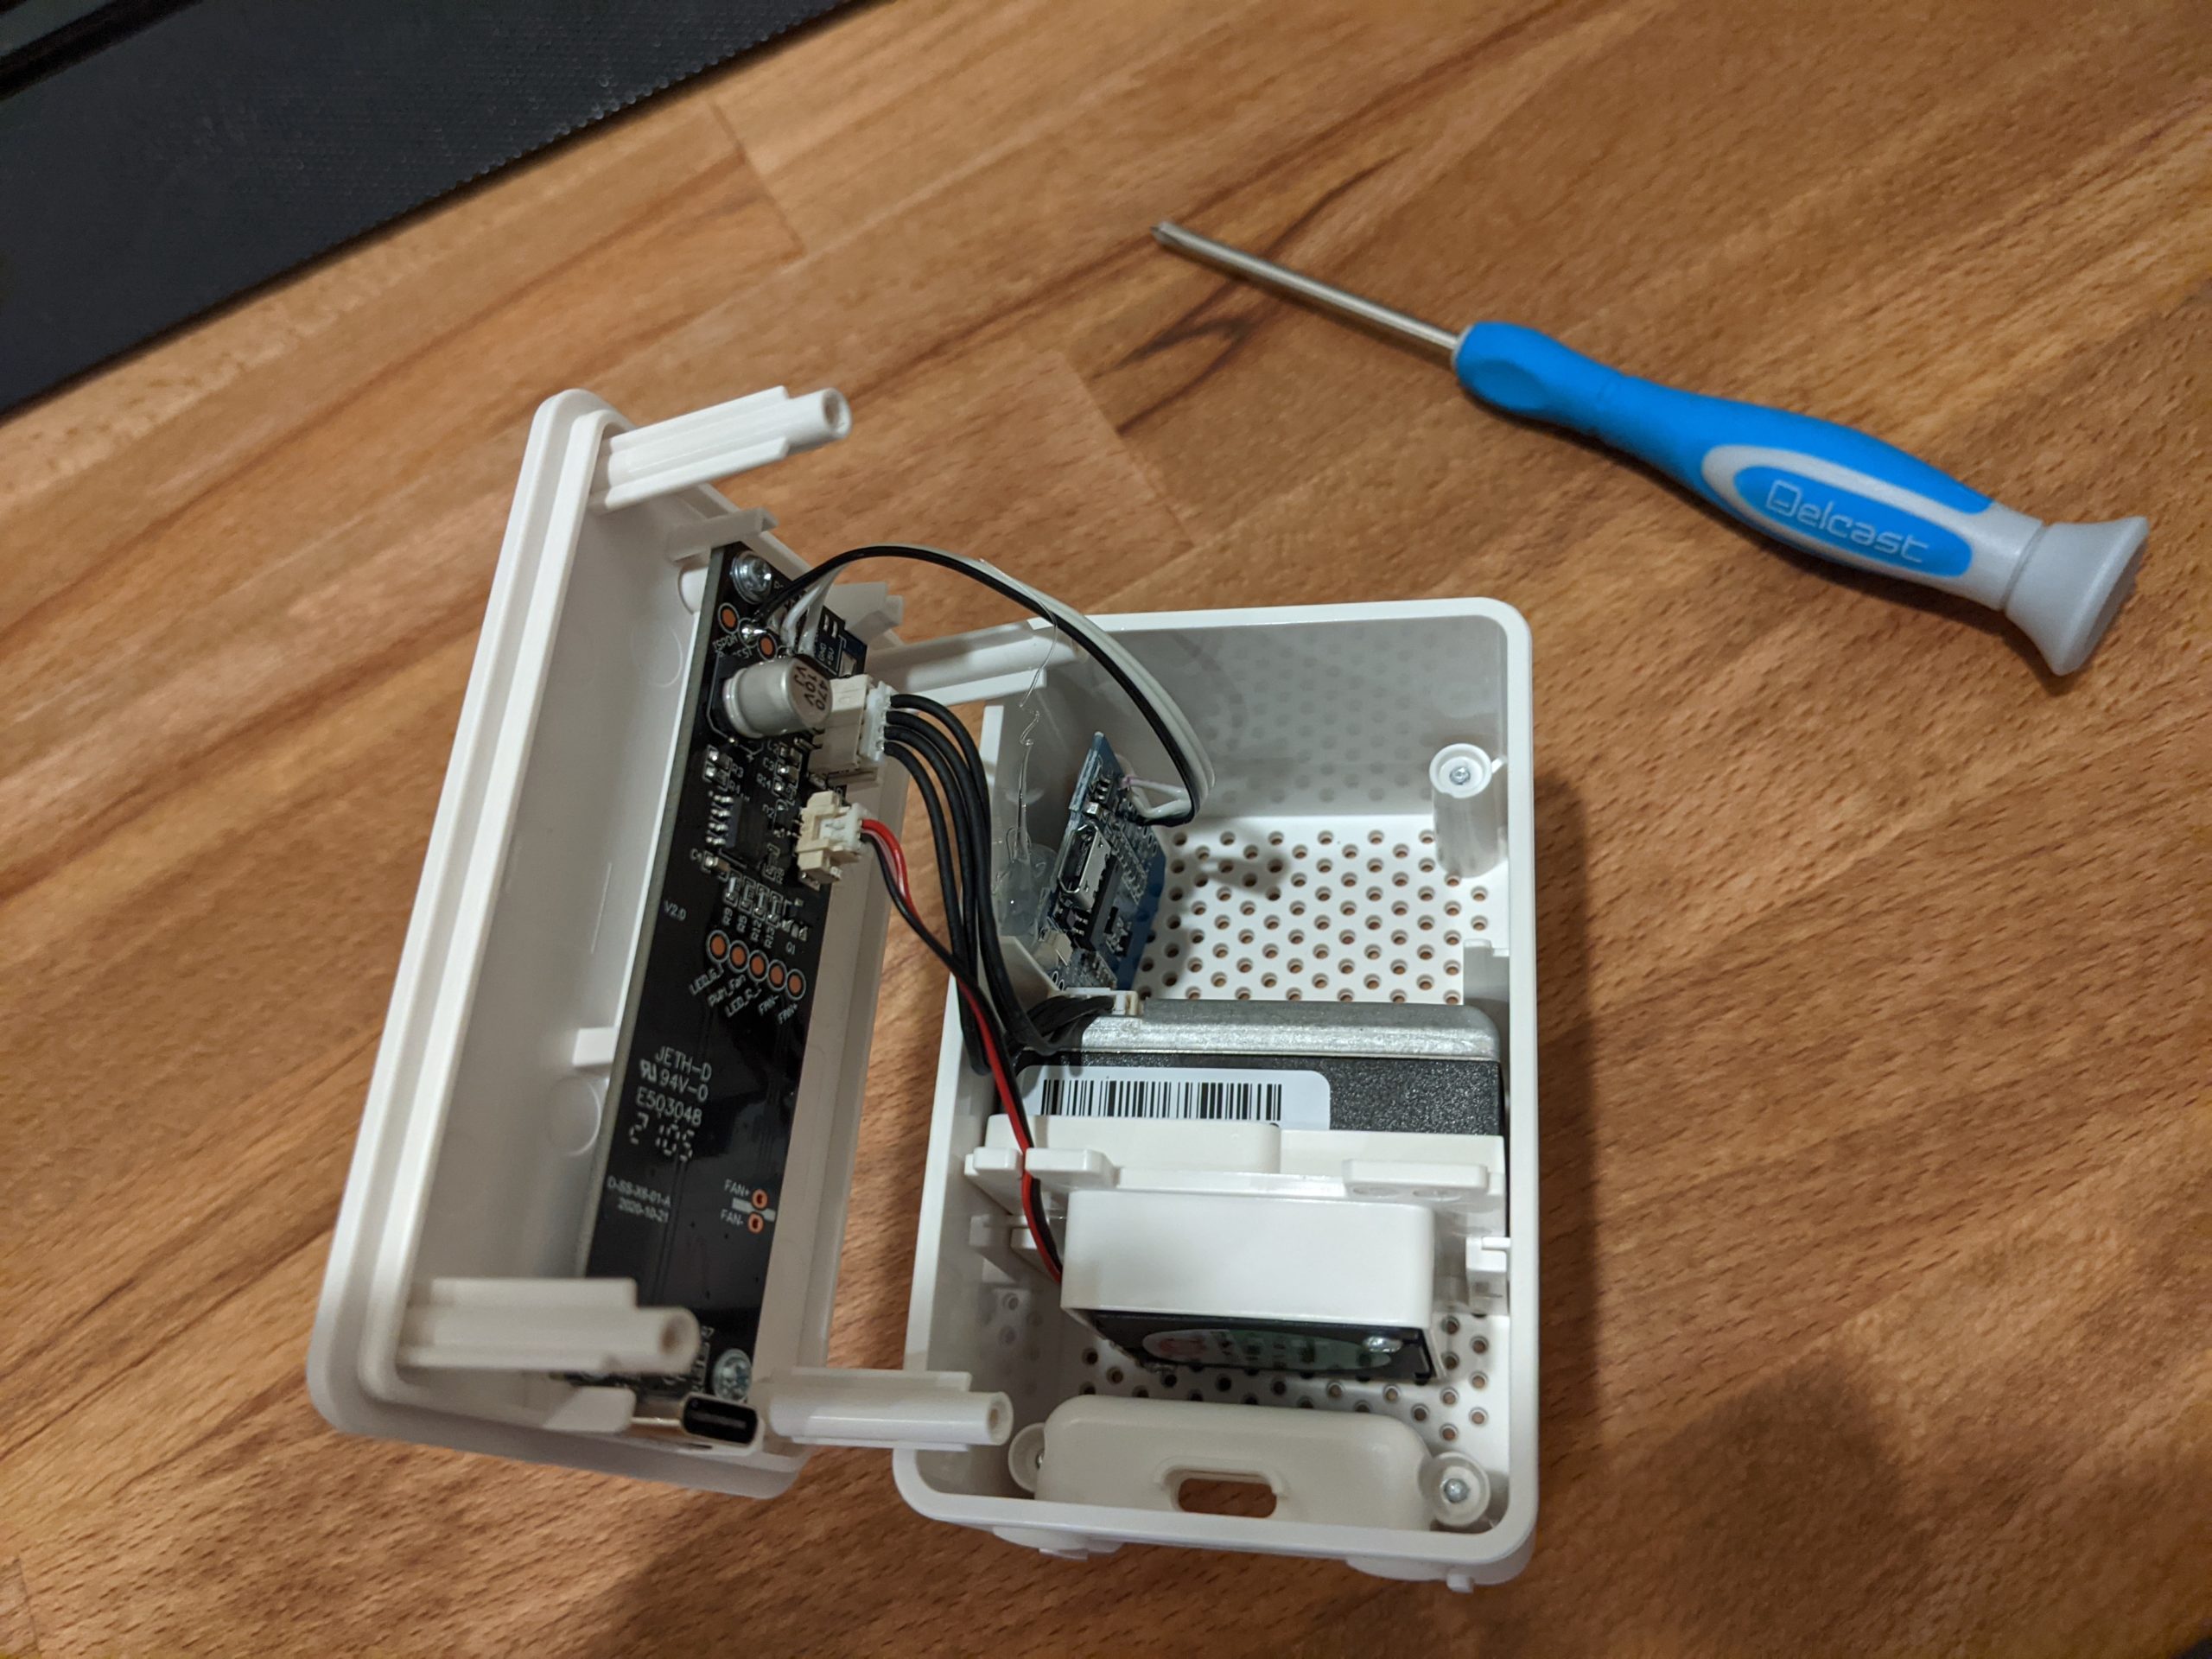
With everything mounted, I closed up the case and powered it on. The D1 mini booted up well and connected to WIFI since I had already configured that. Once it was connected as online in ESPHome, I made the few final updates to its configuration.
The last updates to the ESPHome configuration for it was to setup the sensor reader. I got this configuration from the pull request adding the capabilities to read these types of sensors (link in the resources).
uart:
  rx_pin: GPIO4
  baud_rate: 9600

sensor:
  - platform: pm1006
    pm_2_5:
      name: "Particulate Matter <2.5µm"
With that, I let home assistant integrate the device, and everything worked. I now get the data in my home assistant dashboard along with some stats, the history, min, and max data. This works nicely and will be useful to be able to monitor it (especially in pollen season).